Service sector
Trends in Contribution of the Service Sector
Rising Share in GDP:
The service sector has become the dominant part of India’s economy.In 1950–51: around 30% of GDP
In 1990–91: around 40% of GDP
In 2020s: consistently 55–60% of GDP
This shows that services have been the fastest-growing sector since economic reforms.
High Growth Rates:
Since the 1990s, services like telecom, IT, finance, trade, transport, education, and healthcare have grown at 7–9% per year, higher than agriculture and industry.Structural Transformation without Industrialization:
Unlike Western nations where industrialization came before services, India experienced a direct shift from agriculture to services, bypassing large-scale industrial growth.FDI Concentration in Services:
Sectors like IT-BPM, financial services, telecom, and retail attract majority of FDI inflows, boosting investment and growth.Exports of Services Increasing Rapidly:
India is among the world’s top service exporters:IT and IT-enabled services (ITES)
Business process outsourcing (BPO)
Engineering and research services
Remittances through service jobs abroad
These have strengthened India’s global presence.
Employment Trends:
Although services contribute ~60% of GDP, they employ only 25–30% of the workforce, showing productivity differences across subsectors.
High-skill services (IT, finance) show high productivity, while low-skill services (retail, hospitality) remain labour-intensive and low productivity.
Causes of Rapid Increase of the Service Sector
Economic Reforms (Liberalisation):
Deregulation of telecom, insurance, banking, and foreign trade opened the door for rapid expansion.Growth of IT and Digital Revolution:
India’s large pool of English-speaking, technically skilled workers made the country a global outsourcing hub.Urbanisation and Rising Incomes:
Higher demand for retail, entertainment, tourism, transport, and financial services in cities.FDI and Global Integration:
Multinational service providers in telecom, finance, logistics and e-commerce boosted competition and innovation.Public Sector Withdrawal from Some Areas:
Privatisation and PPP models in telecom, airlines, and infrastructure created more space for private services.Demographic Advantage:
Large young population increased demand for education, healthcare, and digital services.Technology Adoption:
Mobile internet, fintech, app-based services, and online marketplaces expanded the service economy.
Integrated Service Policy
High-end services (IT, finance) are globally competitive, while many others (tourism, transport, health, education, retail) suffer from low productivity
- Skill Development and Human Capital Improvement
- Sector-specific training (tourism, healthcare, logistics, financial services).
- Creation of Service Skill Councils.
- Industry–academia partnerships.
- Impact: Enhances worker productivity, reduces skill mismatches.
- Skill Development and Human Capital Improvement
- Standardisation and Quality Certification
- National standards for hospitality, healthcare, transport, and educational services.
- Service quality benchmarks like ISO certification and customer grievance mechanisms.
- Impact: Improves reliability, reduces inefficiency, builds global competitiveness.
- Digitalisation of Service Delivery
- Expanding e-governance, digital payments, online marketplaces, and cloud services.
- Technology upgradation for MSME service providers.
- Impact: Reduces transaction costs and speeds up service delivery.
- Better Infrastructure for Services
- Transport, logistics, communication networks, airports, smart cities.
- Tourism infrastructure, medical service hubs, IT parks.
- Impact: Enhances the ability of service firms to operate efficiently.
- Regulatory Reforms
- Simplifying licensing, reducing compliance burden.
- Clear rules for e-commerce, fintech, telemedicine, online education.
- Impact: Encourages innovation and investment, reducing informal and low-quality operations.
- Promoting Exports of Services
- Incentives for IT services, consulting, design, animation, research, and healthcare tourism.
- Integrated Service Export Zones (on lines of IT SEZs).
- Impact: Boosts foreign exchange earnings and quality standards.
- Support for MSMEs in Services
- Access to credit, digital tools, marketing support.
- Impact: Helps small enterprises upgrade productivity and compete with large firms.
- Encouraging Public–Private Partnerships
- In healthcare, education, transport, and skill development.
- Impact: Improves quality of service delivery while reducing government burden.
Monetary Policy
Objectives
1. Price Stability (Control of Inflation)
Price stability is the primary objective. High inflation reduces purchasing power and disrupts growth.
RBI aims to maintain inflation at a tolerable and predictable level, especially under the flexible inflation targeting framework.
2. Economic Growth
Monetary policy also supports growth by ensuring adequate credit availability to productive sectors of the economy.
3. Financial Stability
RBI aims to maintain stability in the financial system by regulating banks, preventing asset bubbles, and ensuring confidence in financial institutions.
4. Exchange Rate Stability
Although not fixed, RBI intervenes in forex markets to avoid excessive volatility in the rupee, ensuring stability in external trade.
5. Control of Credit
To regulate the flow of bank credit to priority sectors and prevent misuse of credit for speculative purposes.
6. Promotion of Employment
Indirectly, by supporting growth and maintaining stable prices, monetary policy helps generate employment opportunities.
7. Developmental Role
RBI plays a supportive role in developing financial markets, modern payment systems, and promoting financial inclusion.
Evolution of the Present Monetary Policy Framework
1. Pre-1991: Controlled and Developmental Role
Monetary policy focused on developmental goals rather than strict inflation control.
Dominated by tools like Cash Reserve Ratio (CRR), Statutory Liquidity Ratio (SLR), and direct credit controls.
Interest rates were administered; financial markets were underdeveloped.
Monetisation of fiscal deficit (automatic RBI financing of government borrowing) was common.
2. Post-1991 Reforms: Market-Based Approach
Economic reforms introduced in 1991 marked a turning point.
Key changes:
Deregulation of interest rates.
Reduction of SLR and CRR.
Development of money markets (call money, government securities market).
Shift from direct controls to market-based instruments like repo and reverse repo.
Ending automatic monetisation through the 1997 Agreement between RBI and Government.
Monetary policy became more focused on controlling inflation and managing liquidity.
3. 1998–2005: Adoption of Multiple Indicators Approach
In 1998, RBI officially announced the Multiple Indicators Approach (MIA).
Under MIA, RBI monitored a wide set of indicators like
interest rates,
exchange rate,
bank credit,
fiscal situation,
trade data,
capital flows, and
inflation expectations.
This helped RBI respond to broader macroeconomic trends.
4. 2005–2015: Movement Toward Inflation Targeting
As inflation became persistent after 2008, RBI shifted emphasis towards price stability.
A formal framework started building with the Urjit Patel Committee Report (2014), which recommended adopting inflation targeting.
5. 2016-Present: Flexible Inflation Targeting Framework (FIT)
A historic change came with the amendment to the RBI Act (2016) which institutionalised inflation targeting.
Features of the New Framework:
1. Inflation Target
4% CPI inflation,
with a tolerance band of ± 2%.
Therefore, acceptable inflation is between 2% and 6%.
2. Monetary Policy Committee (MPC)
The MPC was created to bring transparency and collective decision-making.
Composition:
3 members from RBI (including Governor)
3 external experts appointed by the Government
3. Repo Rate as the Main Policy Instrument
The repo rate became the primary tool to signal monetary stance.
RBI uses repo to control liquidity and thereby influence inflation.
4. Accountability
If inflation remains outside 2–6% for three consecutive quarters, MPC must explain the failure and propose corrective action.
5. Communication Policy
MPC publishes:
minutes of meetings,
voting patterns,
inflation forecasts.
This improves transparency and credibility.
6. Current Framework Characteristics
Focused primarily on price stability, but also mindful of growth.
Uses modern tools like:
Repo / Reverse Repo
Open Market Operations (OMO)
Marginal Standing Facility (MSF)
Liquidity Adjustment Facility (LAF)
Standing Deposit Facility (SDF)
A combination of flexibility and predictability defines the system
MSME sector
Challenges
1. Limited Access to Finance
MSMEs struggle to obtain timely and affordable credit.
High collateral requirements, complex documentation, and risk perception by banks reduce credit flow.
Many enterprises operate in the unorganised sector, making formal loans difficult.
2. Technological Obsolescence
Majority use outdated technologies.
Low investment capacity limits adoption of automation, digital tools, and modern production methods.
Results in lower productivity and poor competitiveness.
3. Poor Infrastructure
Inadequate access to industrial land, electricity, logistics facilities, and transport networks.
Raises production costs and reduces efficiency.
4. Low Productivity and Skill Gaps
Lack of skilled labour, limited training facilities, and low managerial capability.
Productivity levels are far below global standards.
5. Marketing Constraints
Difficulty accessing domestic and global markets.
Weak branding, limited digital marketing, dependence on intermediaries.
Inability to meet quality standards required for exports.
6. Regulatory Burden
Complex compliance requirements: GST filing, labour laws, environmental norms.
Small units face high administrative costs relative to their scale.
7. Delayed Payments
Large companies and government departments frequently delay payments.
Affects cash flow, working capital, and survival of MSMEs.
8. Competition from Imports
- Cheap imported goods (especially from China) threaten MSMEs in electronics, toys, textiles, engineering goods.
9. Informality
A majority of micro enterprises are unregistered.
This limits access to formal credit, government schemes, and global markets.
Impact of Global Shocks
- COVID-19 severely disrupted supply chains, labour mobility, and demand, exposing structural vulnerabilities.
Policy Measures to Support MSMEs
1. MSMED Act, 2006
Provides a legal framework for defining MSMEs based on investment and turnover.
Ensures protection against delayed payments through the Micro and Small Enterprises Facilitation Council (MSEFC).
2. Priority Sector Lending (PSL)
Banks are required to allocate 40% of credit to priority sectors including MSMEs.
Introduces special schemes like Mudra loans for micro units.
3. Credit Guarantee Fund Trust for Micro and Small Enterprises (CGTMSE)
Offers collateral-free loans up to ₹2 crore.
Reduces risk for banks and improves access to finance.
4. PMMY (Pradhan Mantri Mudra Yojana)
Provides loans under Shishu, Kishore, Tarun categories for micro businesses.
Focuses on first-time entrepreneurs and small service units.
5. Udyog Aadhaar / Udyam Registration
Simplified one-page online registration.
Helps MSMEs access subsidies, credit schemes, and market linkages.
6. Cluster Development Programme (MSE-CDP)
Supports creation of technology centres, common facility centres, skill hubs, testing labs.
Enhances competitiveness through shared resources.
7. Technology Upgradation Schemes
Credit Linked Capital Subsidy Scheme (CLCSS): 15–20% subsidy for upgrading machinery.
Establishment of Technology Centres offering advanced tools and training.
8. Market Support Initiatives
Public procurement policy: 25% of government purchases reserved for MSMEs (including 4% for SC/ST and 3% for women enterprises).
Government e-Marketplace (GeM) for direct selling to government departments.
Export promotion through SEZs, EPCs, and participation in global fairs.
9. Digital and Innovation Support
Digital MSME scheme: encourages cloud computing and e-commerce adoption.
Start-Up India: supports innovation through funding, incubation, and tax incentives.
10. Relief Measures After COVID-19
Under Atmanirbhar Bharat:
₹3 lakh crore emergency credit line for MSMEs.
Revision of MSME definition (investment + turnover criteria) to expand coverage.
No global tenders for government procurement up to ₹200 crore.
Equity infusion through Fund of Funds.
11. Skill Development
PM Kaushal Vikas Yojana (PMKVY)
Entrepreneurship and Skill Development Programme (ESDP)
These improve workforce productivity and managerial capabilities.
12. Infrastructure Development
- Industrial corridors, plug-and-play facilities, common service centres, and improved logistics through Gati Shakti.
India’s external trade
Important Changes in the Direction of India’s External Trade
1. Shift from Traditional Partners (UK, USA) to Asian Economies
Earlier, India’s major trade partners were the US, UK, and EU.
Now a large share of trade is with China, ASEAN nations, UAE, Saudi Arabia, and other Asian economies.
2. Rise of China as India’s Largest Trading Partner
- China has become the top source of imports, especially in electronics, chemicals, machinery, and pharmaceuticals.
3. Increasing Trade with ASEAN
- After India–ASEAN FTA, trade with Singapore, Malaysia, Thailand, Indonesia, Vietnam has expanded.
4. Trade with Africa and Latin America Growing
India imports crude oil from Nigeria and Angola.
Exports pharmaceuticals, automobiles, and engineering goods to Africa and Latin America.
5. Diversification of Export Markets
- India has reduced overdependence on EU and US and diversified towards Middle East, East Asia, and Africa.
Important Changes in the Composition of India’s External Trade
1. Rise of Manufactured and High-Value Exports
Information technology services, engineering goods, chemicals, pharmaceuticals, and automobiles dominate exports.
Share of primary goods has declined.
2. Decline in Export of Traditional Goods
- Textiles, jute, tea, and leather have lost global competitiveness due to competition from Bangladesh, Vietnam, and China.
3. Expansion of Petroleum and Petrochemical Trade
India's refining capacity has grown.
Exports of petroleum products have increased.
But crude oil remains the largest import item, causing vulnerability.
4. Import Composition: Technology, Electronics, and Capital Goods
- Electronics, telecom equipment, integrated circuits, and capital machinery have replaced earlier imports of food grains.
5. Growth of Services Trade
India is among the top exporters of software, IT-enabled services, business services, and financial services.
Services exports are more than $250 billion, providing crucial foreign exchange earnings.
Reduction of Current Account Deficit (CAD)?
India has often faced a CAD due to high import dependence on oil, gold, and electronic goods. Whether recent trade changes reduce CAD depends on several factors.
HELPFUL
1. Growth of Services Exports
India’s services exports have increased substantially.
IT and business services generate a large trade surplus, which partially offsets the merchandise trade deficit.
This helps in narrowing CAD.
2. Rise of High-Value Manufacturing Exports
Pharmaceuticals, auto components, and engineering goods earn stable foreign exchange.
Export diversification reduces vulnerability to global shocks.
3. Increase in Petroleum Product Exports
India exports refined petroleum products using imported crude.
This adds value and improves trade balance.
4. Trade Diversification
- Reduced dependence on Western markets makes India’s export earnings more stable.
NOT HELPFUL ENOUGH
1. High Import Dependence on Oil
Crude oil accounts for 20–25% of total imports.
Rising global oil prices directly widen CAD.
2. Increasing Imports of Electronics
Electronics have become the second-largest import item after oil.
Lack of domestic semiconductor production increases dependence on China and East Asia.
3. Gold Imports Remain High
- Cultural preference for gold leads to annual imports of 700–900 tonnes, worsening CAD.
4. Weakness in Merchandise Exports
Labour-intensive exports like textiles, leather, and gems & jewellery have not grown fast enough.
Export competitiveness is limited by high logistics cost and infrastructure gaps.
5. Trade Deficit with China
India has a large and growing trade deficit with China, crossing $70–80 billion.
This single deficit offsets gains from other regions.
SUGGESTIONS
While the new trade pattern supports stability, India is still likely to face a CAD unless:
domestic manufacturing strengthens (especially electronics),
renewable energy reduces oil imports,
export competitiveness improves
Demographic Dividend
1. Concept of Demographic Dividend (4 marks)
Demographic Dividend refers to the potential economic growth that can result from changes in a country’s age structure—especially when the proportion of the working-age population (15–64 years) becomes larger than the dependent population (children and elderly).
This situation creates an opportunity for:
Higher labour supply
Increased savings
Greater productivity
Faster economic growth
India is currently experiencing this phase because over 65% of its population is in the working-age group, making it one of the youngest countries in the world.
However, demographic dividend is not automatic. It becomes a dividend only if the workforce is educated, skilled, healthy, and productively employed.
How Can India Harness the Benefits of Demographic Dividend?
1. Investing in Education and Skill Development
Improve school learning outcomes and higher education quality.
Strengthen vocational training, apprenticeships, and digital skills.
Align skills with industry needs (manufacturing, IT, healthcare, logistics).
This increases employability and productivity of the youth.
2. Creating Productive Employment Opportunities
Boost labour-intensive sectors (textiles, tourism, food processing, construction).
Promote MSMEs and startups, which generate maximum jobs.
Encourage manufacturing through schemes like Make in India, PLI, and industrial corridors.
Without job creation, demographic dividend may turn into demographic burden.
3. Improving Health and Nutrition
Healthy workers are more productive.
Reduce malnutrition, anaemia, and maternal health issues.
Expand access to affordable healthcare and insurance (Ayushman Bharat).
This ensures that the working-age population is not only large but capable.
4. Enhancing Women’s Labour Force Participation
Provide childcare support, maternity benefits, flexible work, and safe workplaces.
Educate girls and delay early marriage.
Increasing women’s participation can add millions of workers to the labour force.
5. Promoting Entrepreneurship and Innovation
Support startups with credit, incubators, digital platforms, and market access.
Encourage youth-led innovation in technology, agriculture, and services.
Entrepreneurship converts demographic strength into economic dynamism.
6. Strengthening Urban Infrastructure
Better transport, power, housing, and digital connectivity attract investment.
Planned urbanisation can absorb large labour inflows from rural areas.
7. Regional Development
India’s demographic dividend is uneven—states like Kerala and Tamil Nadu are ageing, while Bihar, UP, MP, and Rajasthan have younger populations.
Policies must focus on:
Migration management
Skill matching
Investments in lagging states
8. Governance and Labour Reforms
Simplify labour laws
Improve ease of doing business
Reduce red tape
This encourages investment and job creation.
Instruments and Institutions of State Intervention
A. Instruments of State Intervention
1. Fiscal Policy
Government uses taxation and public expenditure to influence production, employment, and income distribution.
Examples: subsidies, public investment, progressive taxes.
2. Monetary Policy
Through the RBI, the state regulates money supply, interest rates, and credit to stabilise prices and maintain financial stability.
3. Regulatory Measures
Laws and regulations governing labour markets, environment, competition, prices, and quality standards.
Examples: Competition Act, labour codes, environmental norms.
4. Public Sector Enterprises (PSEs)
Government directly participates in production through PSUs in sectors such as energy, transport, and mining where private sector is unwilling or unable to invest.
5. Trade and Industrial Policies
Import tariffs, export incentives, licensing, and industrial promotion policies to guide industrial development and protect domestic industry.
6. Welfare and Social Policies
Provision of healthcare, education, food security (PDS), MGNREGA, social security, and poverty alleviation programmes to ensure equity and social justice.
B. Institutions of State Intervention
1. Central Government
Formulates economic policies (Budget, industrial policy, trade policy).
2. Reserve Bank of India
Implements monetary policy and ensures financial stability.
3. Planning Bodies / NITI Aayog
Provides long-term strategies, coordination, and development planning.
4. Regulatory Authorities
SEBI (capital markets), TRAI (telecom), IRDAI (insurance), CCI (competition), etc.
5. Public Sector Enterprises
Undertake strategic production, infrastructure creation, and service provision.
6. State Governments & Local Bodies
Implement policies in agriculture, education, health, labour markets, and local infrastructure.
Need for State Intervention in the Market
1. Correcting Market Failures
Markets may fail due to monopoly power, information asymmetry, public goods, and externalities (pollution).
State intervention ensures efficient allocation of resources.
2. Promoting Equity and Reducing Inequality
Markets typically favour those with higher incomes.
Government uses taxation, subsidies, welfare schemes, and affirmative policies to promote distributive justice.
3. Providing Public Goods and Essential Services
Private sector does not produce goods like defence, roads, basic healthcare, and sanitation because they are non-profitable.
The state ensures their provision.
4. Stabilising the Economy
To manage inflation, unemployment, recessions, and booms, the government uses fiscal and monetary policies to maintain macroeconomic stability.
5. Supporting Strategic Sectors
Certain sectors (energy, defence, railways) require huge investments and have national security implications.
State intervention ensures development of such sectors.
6. Protecting Vulnerable Groups
The poor, farmers, unorganised workers, and small businesses need state support through minimum wages, MSP, subsidies, and social safety nets.
Fiscal Federalism
Fiscal federalism refers to the system of financial relations between different levels of government—central, state, and local bodies—within a federal structure. It determines:
how revenue-raising powers are distributed,
how expenditure responsibilities are assigned, and
how financial transfers (grants, tax devolution) flow from the Centre to the States.
In India’s federal system, fiscal federalism is essential because:
states have large expenditure responsibilities (health, education, agriculture, law and order)
but limited taxation powers (mainly GST share, excise on alcohol, property tax, stamp duties).
Hence, fiscal federalism ensures efficient resource allocation, equity among states, and balanced regional development.
Critical Issues in Fiscal Federalism in India
1. Vertical Imbalance
There is a mismatch between:
Centre’s large revenue-raising powers, and
States’ larger expenditure responsibilities.
States depend heavily on transfers through Finance Commissions and centrally sponsored schemes.
2. Horizontal Imbalance
Different states have unequal:
revenue capacities,
development needs, and
population sizes.
Economically stronger states (Maharashtra, Gujarat, Karnataka) collect higher revenues, while poorer states rely more on central transfers—leading to persistent regional disparities.
3. GST and Revenue Uncertainty
The introduction of GST in 2017 replaced many state taxes, reducing states’ fiscal autonomy.
Critical issues:
Dependence on GST compensation from the Centre.
Lower-than-expected GST collections.
Delayed compensation during COVID-19 created friction.
4. Increasing Centralisation of Resources
A rising share of revenue is tied in Centrally Sponsored Schemes (CSS).
States have limited flexibility in designing programmes according to local needs.
After the 14th Finance Commission increased tax devolution, the Centre reduced untied grants, limiting states’ autonomy.
5. Borrowing Constraints on States
Under the FRBM Act and central regulations:
states’ borrowing is capped,
their fiscal deficit must remain within limits set by the Centre.
This restricts states’ ability to invest in infrastructure and social sectors.
6. Declining Role of Finance Commissions
While Finance Commissions decide tax-sharing and grants every 5 years,
their recommendations often clash with:
GST Council decisions,
centrally sponsored programmes,
NITI Aayog advisory roles.
This creates ambiguity in the institutional structure of fiscal federalism.
7. Political Issues and Centre–State Conflict
Political differences influence:
allocation of funds,
approval of schemes,
negotiations within the GST Council.
Opposition-ruled states often accuse the Centre of discrimination in discretionary transfers.
8. Weak Fiscal Capacity of Local Governments
Panchayats and municipalities collect very little revenue and rely overwhelmingly on state transfers.
This undermines the 73rd and 74th Constitutional Amendments and restricts grassroots development.
How Is Fiscal Imbalance Measured?
Fiscal imbalance is measured using the following key indicators:
1. Fiscal Deficit
Fiscal Deficit = Total Expenditure – (Revenue Receipts + Non-debt Capital Receipts)
A rising fiscal deficit indicates growing imbalance.
2. Revenue Deficit
Revenue Deficit = Revenue Expenditure – Revenue Receipts
Shows whether the government is borrowing to meet current consumption expenditure.
3. Primary Deficit
Primary Deficit = Fiscal Deficit – Interest Payments
Indicates fiscal stress excluding interest burden.
4. Debt–GDP Ratio
High public debt relative to GDP signals long-term imbalance.
5. Interest Payment Burden
A rising share of interest payments in total expenditure reflects unsustainable deficits.
These indicators together show the extent and nature of fiscal imbalance in the economy.
Fiscal Responsibility and Budget Management (FRBM) Act in Correcting Fiscal Imbalances
The FRBM Act was enacted in 2003 to ensure fiscal discipline by limiting deficits and public debt.
Its goals:
Reduce fiscal deficit to 3% of GDP
Eliminate revenue deficit
Improve transparency and macroeconomic stability
A. Achievements
1. Improved Fiscal Discipline in Early Years (2003–2008)
Fiscal deficit declined from around 6% of GDP (early 2000s) to below 3.5%.
Revenue deficit also reduced significantly.
This showed positive impact of FRBM targets.
2. Greater Transparency and Reporting
- Mandatory fiscal statements, Medium-Term Fiscal Policy (MTFP) reports, and debt data improved transparency.
3. Institutionalizing Fiscal Responsibility
States enacted their own FRBM laws, improving fiscal health across the country.
The Act created a culture of rule-based fiscal policy.
4. Anchoring of Market Expectations
- Bond markets gained confidence due to predictable fiscal path, lowering borrowing costs.
B. Limitations and Challenges
1. Frequent Deviations from Targets
Global Financial Crisis (2008), economic slowdown, and Covid-19 forced continuous deviations.
FRBM escape clauses were frequently used.
2. Revenue Deficit Not Eliminated
Government still borrows for revenue expenditure, which FRBM aimed to stop.
3. Capital Expenditure Constraints
Pressure to meet fiscal targets sometimes led to cuts in capital expenditure—hurting growth.
4. Off-Budget Borrowings
Food subsidy arrears, oil bonds, and special purpose vehicles allowed governments to keep deficits artificially low, reducing effectiveness.
5. Lack of Strong Penalties
FRBM has no strict enforcement mechanism; compliance depends on political will.
Production and productivity of major food crops
Trends in Production of Major Food Crops in the Post–Green Revolution Era
1. Significant Increase in Foodgrain Output
Foodgrain production rose from about 72 million tonnes in 1965–66 to over 330 million tonnes in 2022–23.
Wheat and rice showed the highest growth due to HYVs, irrigation, fertilizers, and mechanisation.
2. Regional Concentration
Production growth was concentrated in Punjab, Haryana, and Western Uttar Pradesh, creating regional imbalances.
Later, states like MP, Chhattisgarh, Bihar, and Odisha increased production due to NFSM and MSP reforms.
3. Crop Diversification in Recent Decades
While wheat and rice grew rapidly initially, recent years show:
Higher production of pulses (tur, urad, moong) due to price incentives.
Increase in coarse cereals (jowar, bajra, maize) due to climate-resilient farming and government promotion.
Trends in Productivity of Major Food Crops
1. Steady Rising Productivity of Wheat and Rice
Wheat productivity increased from 1.3 tonnes/ha (1970s) to >3.4 tonnes/ha.
Rice productivity increased from 1.1 tonnes/ha to >2.8 tonnes/ha.
This reflects advances in seed technology and irrigation.
2. Pulses and Coarse Cereals Show Late Improvement
Pulses remained stagnant for decades but improved after 2008 due to MSP hikes and micro-irrigation.
Maize productivity increased sharply because of hybrid seeds.
3. Productivity Growth Slowing Down Recently
Stagnation in traditional Green Revolution states due to:
soil degradation,
overuse of water,
declining input response.
New states (MP, Rajasthan, Chhattisgarh) are now driving productivity gains.
Steps Taken by the Government to Increase Productivity of Food Crops
1. High-Yielding Varieties (HYVs) and Seed Programmes
Promotion of high-yield and climate-resilient varieties.
National Seeds Corporation and State Seed Farms ensure availability of quality seeds.
2. Expansion of Irrigation
Major, medium, and micro-irrigation projects.
PMKSY (Pradhan Mantri Krishi Sinchai Yojana) for “Har Khet Ko Pani”.
Promotion of drip and sprinkler systems.
This reduces dependence on monsoon.
3. Improved Input Use
Subsidies on fertilizers, soil health cards for balanced nutrient use.
Promotion of organic and natural farming in some regions.
4. MSP and Procurement Policies
Minimum Support Price for wheat, rice, pulses, coarse cereals.
Public procurement incentivises farmers to adopt improved technologies and invest more.
5. National Food Security Mission (NFSM)
Launched in 2007 to increase production of rice, wheat, pulses, coarse grains.
Provides assistance for:
improved seeds,
soil amendments,
farm machinery,
cropping system intensification.
NFSM significantly improved productivity in central and eastern India.
6. Use of Technology and Mechanisation
Custom Hiring Centres for tractors, harvesters, planters.
Promotion of farm mechanisation through subsidies.
Digital tools (Kisan apps, remote sensing) for precision agriculture.
7. Strengthening Research & Extension
ICAR and agricultural universities focus on new varieties, pest-resistant seeds, and climate-resilient farming.
Krishi Vigyan Kendras help transfer technology to farmers.
8. Crop Insurance and Risk Management
PMFBY (Pradhan Mantri Fasal Bima Yojana) protects farmers from climatic shocks.
Encourages continued investment in productivity-enhancing inputs.
Environmental consequences of economic development
1. Air Pollution and Deterioration of Air Quality
- Rapid urbanisation, rise in vehicles, thermal power plants, construction dust, and industrial emissions have made Indian cities among the most polluted globally.
- Delhi, Mumbai, Kanpur, Lucknow, and other urban centres consistently record high PM2.5 and PM10 levels.
- Health impacts include respiratory diseases, heart ailments, and reduced life expectancy.
2. Water Pollution and Water Stress
- Industrial effluents, untreated sewage, pesticides from agriculture, and waste disposal have polluted rivers like the Ganga, Yamuna, and Cauvery.
- Over-extraction of groundwater for agriculture and urban use has caused depletion of aquifers.
- Many states face severe groundwater stress (Punjab, Haryana, Rajasthan, Tamil Nadu).
3. Land Degradation and Soil Erosion
- Intensive agriculture, excessive fertilizer use, monocropping, and deforestation have degraded soil quality.
- Around 30% of India’s land suffers from degradation due to erosion, salinization, and nutrient loss.
4. Loss of Forests and Biodiversity
- Infrastructure projects, mining, urban expansion, and agricultural conversion have reduced forest cover in many regions.
- Loss of wildlife habitats has endangered species like tigers, elephants, and various birds and reptiles.
5. Climate Change Impacts
India’s rising carbon emissions from energy, industry, and transport contribute to global warming.
- Consequences include:
rising temperatures,
irregular monsoons,
more frequent floods and droughts,
extreme weather events (heatwaves, cyclones).
6. Solid Waste and Plastic Pollution
- Urban growth has created enormous volumes of municipal waste.
- Inefficient waste management leads to landfill overflows, groundwater contamination, and plastic accumulation in rivers and oceans.
- Single-use plastics remain a major contributor.
Why Have These Environmental Impacts Increased?
1. Rapid Industrialisation and Urbanisation
- Over the last two decades, India’s focus on manufacturing, construction, transport, mining, and real estate has increased environmental pressure.
- Expansion of cities has created congestion, waste, and air pollution.
2. Energy Demand and Fossil Fuel Dependence
- Economic growth led to a surge in energy demand.
- Coal-based power plants, which account for the majority of electricity generation, emit high levels of CO₂, SO₂, and particulate matter.
3. Agricultural Intensification
- High-yield farming uses large quantities of fertilizers, pesticides, and irrigation, degrading land and polluting water.
- Groundwater overuse is common in states dependent on tube wells.
4. Weak Environmental Regulations and Enforcement
- Although India has environmental laws, enforcement is often weak due to limited capacity, corruption, and political pressure to prioritise growth over sustainability.
- Industries often discharge untreated waste into rivers and air.
5. Pressure of Population Growth
- India’s rising population increases demand for energy, water, housing, and infrastructure.
- More consumption generates more waste and stress on natural resources.
6. Climate Vulnerability and Unsustainable Development Patterns
- Development often occurs without considering ecological sensitivity—hills, coasts, and forest areas are used for roads, hydropower, mining, and tourism.
- This has led to landslides, coastal erosion, and loss of ecosystem services.
Regional disparities
Causes
1. Historical and Geographical Factors
States with fertile land (Punjab, Haryana) or coastal access (Maharashtra, Gujarat, Tamil Nadu) industrialised earlier.
Hilly, arid, and tribal regions (Northeast, Rajasthan, Jharkhand) faced natural constraints such as poor soil, difficult terrain, and weak connectivity.
2. Uneven Industrial Development
Industrial investment is concentrated in states with better infrastructure and urbanisation.
Backward states lacked electricity, transport, skilled labour, and capital, discouraging private investment.
3. Inadequate Infrastructure
Poor roads, limited irrigation, weak power supply, and low digital connectivity in eastern and central India restrict economic opportunities.
Better infrastructure in western and southern states attracts industries and services.
4. Low Human Development Levels
States like Bihar, Uttar Pradesh, Odisha, and MP have lower literacy rates, poor healthcare, and high population pressure.
Low human capital reduces productivity and growth.
5. Agricultural Backwardness
Dependence on monsoon, small landholdings, and low productivity trap many regions in subsistence agriculture.
Lack of diversification and irrigation widens gaps with regions practicing commercial agriculture.
6. Administrative and Governance Weaknesses
Corruption, inefficient governance, delays in project implementation, and weak law and order discourage investment.
Some states are unable to utilise central funds effectively.
7. Lack of Urbanisation
Urbanisation creates jobs and markets.
States with fewer cities experience slower industrial and service-sector growth.
Steps Taken by the Government to Reduce Regional Disparities
1. Special Category Status and Financial Assistance
Northeastern states, Himachal Pradesh, Uttarakhand, and J&K received higher central grants, tax exemptions, and subsidies.
Aimed at improving infrastructure and attracting investment.
2. Backward Regions Grant Fund (BRGF)
Targeted funding for backward districts to improve infrastructure, governance, and development planning.
Focus on districts in Bihar, Odisha, Rajasthan, MP, and UP.
3. Decentralised Planning: 73rd and 74th Amendments
Empowered Panchayats and Municipalities to plan and implement local development activities.
Improved allocation of resources based on local needs.
4. Promotion of Industrial Development in Backward Regions
Freight equalisation policies (historically), tax incentives, and establishment of industrial estates.
Creation of SEZs, industrial corridors (Delhi–Mumbai, Amritsar–Kolkata), and Mega Food Parks.
5. Infrastructure Development Initiatives
Bharatmala, Sagarmala, UDAN, rural electrification, and PMGSY (rural roads).
These projects connect remote regions with markets and improve mobility.
6. Targeted Schemes for Agriculture and Rural Development
PMKSY (irrigation), NFSM (food crops), and watershed development programs support backward agricultural regions.
MGNREGA provides employment and builds rural assets.
7. Northeastern and Tribal Area Development
Dedicated ministries and schemes like
North Eastern Council (NEC),
DONER Ministry,
Tribal Area Sub-Plan (TASP),
Aspirational Districts Programme (2018) targeting the most backward 112 districts.
8. Fiscal Transfers through Finance Commissions
- Horizontal devolution ensures higher transfers to poorer states based on population, income distance, and need.
- Creates fiscal space for backward states to invest in social and physical infrastructure.
Social security schemes
The Government of India has launched several social security schemes aimed at providing protection to the poor, workers, elderly, and vulnerable groups. Major schemes include:
1. National Social Assistance Programme (NSAP)
Includes:
Indira Gandhi National Old Age Pension Scheme (IGNOAPS)
Widow Pension Scheme (IGNWPS)
Disability Pension Scheme (IGNDPS)
Provides direct pensions to elderly, widows, and disabled persons from poor households.
2. Pradhan Mantri Jan Dhan Yojana (PMJDY)
Financial inclusion scheme offering bank accounts with:
accident insurance,
life insurance,
overdraft facility.
3. Insurance Schemes (2015 Onwards)
Pradhan Mantri Suraksha Bima Yojana (PMSBY): Accidental death/disability insurance.
Pradhan Mantri Jeevan Jyoti Bima Yojana (PMJJBY): Life insurance for low-income groups.
4. Atal Pension Yojana (APY)
A contributory pension scheme for unorganised sector workers guaranteeing ₹1,000–₹5,000 monthly pension after 60 years.
5. Mahatma Gandhi National Rural Employment Guarantee Act (MGNREGA)
Ensures 100 days of unskilled wage employment to rural households—provides income security.
6. Employees’ Provident Fund (EPF) & Employees’ State Insurance (ESI)
For organised sector workers, offering social security, health insurance, and retirement benefits.
Drawbacks of MGNREGA
1. Delay in Wage Payments
Payments often get delayed due to slow administrative processing, shortage of funds, and technical issues in the banking system.
2. Corruption and Leakages
Ghost beneficiaries, fake job cards, and inflated muster rolls reduce the effectiveness of the scheme.
3. Poor Quality of Assets Created
Many works (ponds, roads, check dams) remain unfinished or poorly maintained due to weak planning and technical supervision.
4. Lack of Awareness Among Workers
Many households are not aware of their legal entitlement to demand work for 100 days, leading to underutilisation.
5. Insufficient Number of Skilled Supervisors
Limited technical staff causes poor planning, low productivity, and delays in completing projects.
6. Seasonal and Irregular Work Availability
Work is not available throughout the year in many areas, despite the legal guarantee.
Additional Problems Observed in Implementation
1. Inadequate Funding and Budget Cuts
Funds often run short, leading to delayed payments and rationing of work.
2. Political Interference
Local elites sometimes influence work allocation, favouring certain groups and excluding others.
3. Poor Monitoring and Social Audits
Though social audit is mandatory, many states do not conduct them properly, weakening accountability.
4. Limited Impact on Skill Development
Since work is mostly unskilled, it does not create long-term employability for workers.
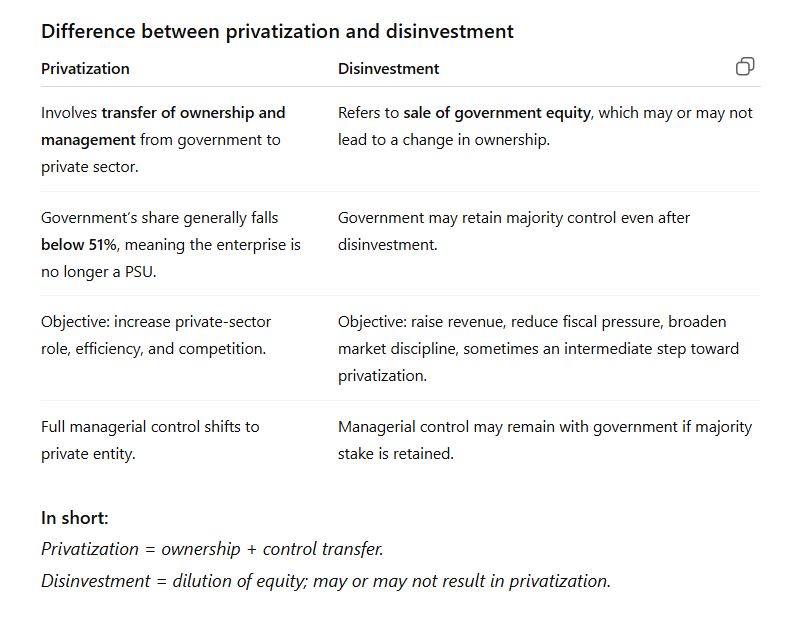
Disinvestment vs. Privatisation
What is disinvestment?
Disinvestment refers to the sale of a part or whole of the government’s equity holdings in Public Sector Enterprises (PSEs).
The objective is usually to reduce the fiscal burden, raise resources, increase efficiency, and introduce private-sector discipline into public enterprises.
It may involve selling shares to the public, financial institutions, or strategic private partners.
Conditions needed for making disinvestment policy a success
Clear and Consistent Policy Framework
– Government must set transparent objectives: revenue generation, efficiency improvement, or strategic restructuring.
– Policies should be stable over time to build investor confidence.Strong Regulatory Mechanism
– Independent regulators in sectors like power, telecom, civil aviation etc.
– Ensures fair competition and prevents private monopolies after disinvestment.Proper Valuation of PSUs
– Accurate valuation is crucial to avoid selling assets below their real worth.
– Professional valuation agencies and transparent bidding processes are needed.Efficient Capital Market Conditions
– A well-functioning stock market ensures optimal pricing of government shares.
– Adequate demand from institutional and retail investors improves success.Political Consensus and Public Support
– Political resistance often delays or reverses disinvestment.
– Consensus reduces uncertainty and helps in smooth implementation.Selection of Strategic Partners
– When strategic disinvestment is done, credible private players with the ability to modernize and improve efficiency must be chosen.Improved Corporate Governance in PSUs
– Professional management, autonomy, and accountability make PSUs more attractive to investors.Transparency in Process
– Open bidding, published criteria, and third-party oversight build trust and minimise controversies.
Policies regarding PPP (Public-Private Partnership)
The Government of India follows a structured, model-based and facilitative PPP policy aimed at expanding infrastructure through private participation while safeguarding public interest.
Key features include:
Promotion of PPPs in core infrastructure such as roads, ports, airports, power, railways, urban services, and health/education.
Standardized PPP frameworks like the Model Concession Agreement (MCA), Viability Gap Funding (VGF) scheme, and Guidelines for Appraisal of PPP Projects.
Transparent bidding and competitive procurement through the Public Private Partnership Appraisal Committee (PPPAC).
Risk-sharing between public and private partners, where risks are allocated to the party best able to manage them.
Financial support through VGF (up to 40% of project cost), India Infrastructure Finance Company Ltd. (IIFCL), and long-term financing through infrastructure funds.
Institutional strengthening with bodies like NITI Aayog’s PPP Cell and the Department of Economic Affairs (DEA) Infrastructure Division
Benefits to India from PPP collaboration
PPP has significantly accelerated infrastructure creation, improved service quality, and reduced public expenditure burden. Major benefits include:
1. Rapid expansion of transport infrastructure
Golden Quadrilateral & National Highways (PPP in BOT/DBFOT models): Improved connectivity, reduced travel time, and increased freight efficiency.
Mumbai–Pune Expressway and Delhi–Gurgaon Expressway: High-quality highways built faster than public sector alone could manage.
2. Modernization of airports
Delhi and Mumbai Airports (GMR & GVK consortia): Expanded terminals, world-class infrastructure, higher passenger handling capacity.
Hyderabad and Bengaluru Airports: Built entirely through PPP, now major aviation hubs.
3. Urban infrastructure improvements
Delhi Metro Airport Express Line (PPP with Reliance Infra): Faster airport connectivity.
Nagpur and Indore Smart City Projects: Private participation in water supply, waste management, and ICT services.
4. Power sector advancement
- Ultra Mega Power Projects (Mundra, Sasan) through PPP: Large additions to power generation capacity and lower tariff bids.
5. Community and health services
Andhra Pradesh e-Seva, Karnataka’s Nemmadi Centres: PPP-enabled digital service delivery to citizens.
National Dialysis Programme (PPP in district hospitals): Increased access to affordable dialysis.
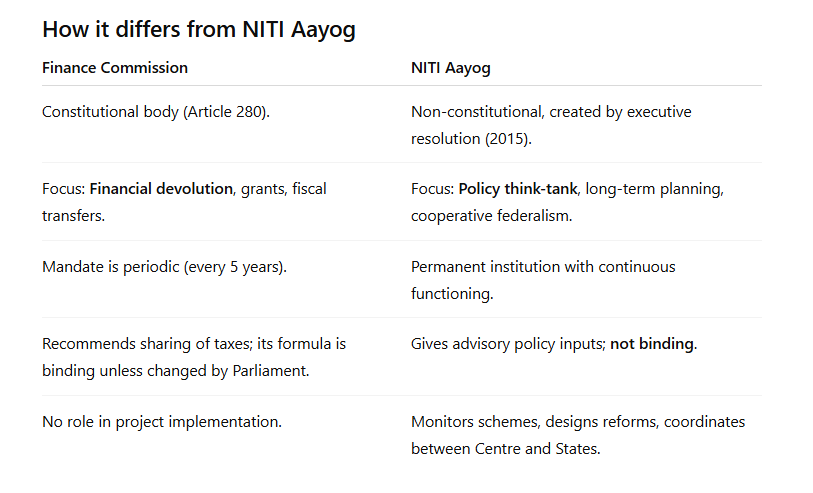
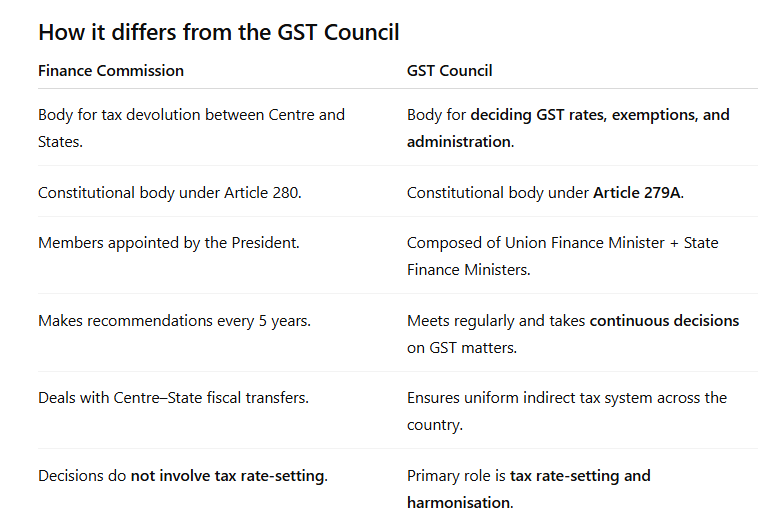
Finance Commission & NITI Aayog
The Finance Commission of India is a constitutional body established under Article 280.
Its main function is to recommend how financial resources should be distributed between:
Union and States (vertical devolution), and
Among the States themselves (horizontal distribution).
It also recommends:
Principles for grants-in-aid,
Measures to improve fiscal discipline,
Ways to augment the resources of panchayats and municipalities.
The Commission is appointed every five years and is independent of the government.
Discussion on Centre-state relations
Centre–state relations have become a central topic of debate in India because the federal structure must continuously adapt to political, economic, and administrative changes. As India has moved from a one-party dominant system to coalition politics, from a planned economy to a market-oriented system, and from centralised governance to decentralisation, the balance of power between the Centre and States has come under scrutiny.
Reasons for conflict
1. Fiscal Imbalance (Vertical and Horizontal)
The Centre controls major tax sources, while States have higher expenditure responsibilities.
Dependence on central transfers (Finance Commission, grants, CSS schemes) creates tensions.
2. Centralisation in Planning and Resource Allocation
Central schemes and conditions under Centrally Sponsored Schemes (CSS) often reduce States’ flexibility.
States demand more decision-making power and untied funds.
3. GST-Related Concerns
Loss of independent taxation powers after GST.
Delays in GST compensation created friction between the Centre and several States.
4. Political Differences
When different parties govern the Centre and States, disputes arise over misuse of agencies, Governor’s role, fund allocation, and policy priorities.
Non-BJP states have often accused the Centre of bias in resource distribution.
5. Role of Governors
Governors, appointed by the Centre, sometimes withhold bills, delay approvals, or intervene politically.
States view this as an encroachment on their autonomy.
6. President’s Rule (Article 356)
Historically used excessively, especially before the 1990s, to dismiss state governments.
Though reduced after the S.R. Bommai judgment, concerns remain.
7. Inter-State Water Disputes
Centre’s tribunals and interventions sometimes conflict with state interests.
Examples: Cauvery dispute, Krishna-Godavari, Ravi-Beas.
8. Internal Security and Law & Order
- Issues like deployment of central forces, anti-terror laws, and AFSPA create friction with States who seek greater control over policing.
9. Devolution to Local Bodies
- Centre’s and State’s competing claims over local governance create administrative overlap.
Foreign Capital
Types
Foreign capital refers to all inflows of external financial resources into a country. Major types include:
1. Foreign Direct Investment (FDI)
Investment by a foreign entity in productive assets such as factories, infrastructure, or services.
It involves ownership, control, technology transfer, and long-term commitment.
2. Foreign Portfolio Investment (FPI)
Investment in financial assets like shares, bonds, and securities.
It is short-term, market-driven, and does not involve management control.
3. External Commercial Borrowings (ECBs)
Loans raised by Indian companies from foreign lenders at commercial rates.
Includes bank loans, buyers’ credit, and suppliers’ credit.
4. Foreign Aid (Official Development Assistance)
Grants, concessional loans, or technical assistance provided by foreign governments or international institutions (World Bank, ADB, IMF).
5. NRI/Overseas Deposits
Non-resident Indians invest in bank deposits like FCNR, NRE, NRO accounts.
6. Venture Capital and Private Equity from Foreign Investors
Funds for startups and high-growth firms involving risk-sharing.
Foreign Capital Contributes to Economic Growth
1. Investment and Capital Formation
FDI increases the availability of funds for industrial expansion, infrastructure creation, and modernization.
2. Technology Transfer
Foreign firms bring advanced technology, managerial skills, and innovation that improve productivity.
3. Employment Generation
FDI-led projects create direct jobs and additional indirect employment through supply chains.
4. Export Promotion
Multinational firms help integrate India into global value chains (IT services, automobiles, pharma).
5. Improved Competition and Efficiency
Entry of global firms increases competition, reducing costs and improving quality.
6. Development of Infrastructure
FDI in telecom, airports, power, and roads helps build critical infrastructure.
7. Foreign Exchange Earnings
Boosts exports, increases reserves, and stabilizes the balance of payments.
Important Reforms Introduced to Attract FDI in India
1. Liberalization of FDI Policy (Post-1991)
- Automatic route introduced in many sectors
- Higher sectoral caps (e.g., telecom, insurance, defence)
- Reduction in bureaucratic approvals
2. Opening of New Sectors
100% FDI allowed in single-brand retail, construction, e-commerce marketplaces, railway infrastructure, healthcare, and renewable energy.
Defence sector increased to 74% automatic and 100% with approval.
3. Simplification through Automatic Route
More than 90% of FDI inflows come through automatic approval, reducing delays.
4. Make in India and Production-Linked Incentive (PLI) Schemes
Enhanced incentives for electronics, solar, pharma, semiconductors, automobiles, and textiles to attract foreign manufacturers.
5. Establishment of Invest India
A national investment promotion agency offering facilitation, dispute redressal, and single-window clearance.
6. Ease of Doing Business Reforms
GST introduction
Insolvency and Bankruptcy Code (IBC) for faster dispute resolution
Digital approvals, online licensing, and reduced compliance burden
7. Special Economic Zones (SEZs) and Industrial Corridors
World-class infrastructure and tax incentives to attract foreign firms.
8. Bilateral Investment Treaties and Tax Reforms
Revised treaties to ensure investor confidence while preventing tax evasion.
Institutional Structure for Good Governance
The Constitution of India establishes a comprehensive institutional framework to promote accountability, transparency, rule of law, and efficient public administration, all essential for good governance. Key constitutional provisions include:
1. Legislature (Parliament and State Legislatures)
Makes laws, approves budgets, and holds the executive accountable through debates, questions, and committees.
Ensures democratic oversight and representation.
2. Executive (Union and State Governments)
Responsible for implementing laws, delivering public services, and maintaining administration.
Operates under constitutional limits and judicial scrutiny.
3. Judiciary (Supreme Court, High Courts, Subordinate Courts)
Guarantees rule of law, protects fundamental rights, and checks arbitrary power.
Judicial review ensures governance within constitutional boundaries.
4. Comptroller and Auditor General (CAG)
Independent authority responsible for auditing government accounts and expenditures.
Ensures financial accountability.
5. Election Commission of India (ECI)
Conducts free and fair elections, a core requirement of good governance.
Regulates political parties, voter rolls, and election procedures.
6. Union and State Public Service Commissions (UPSC & SPSC)
Ensure merit-based recruitment for civil services.
Prevents political interference and builds administrative professionalism.
7. Finance Commission
Ensures fair distribution of financial resources between Centre and States.
Promotes fiscal federalism.
8. Local Self-Governments (Panchayats and Municipalities)
Enabled by the 73rd and 74th Constitutional Amendments.
Decentralises power and promotes participatory governance.
Major Oversight / Watchdog Institutions and Their Roles
1. Comptroller and Auditor General (CAG)
Audits accounts of Union, States, PSUs, and autonomous bodies.
Identifies misuse of funds, inefficiency, and corruption.
Reports submitted to Parliament for scrutiny by Public Accounts Committee (PAC).
2. Election Commission of India (ECI)
Conducts and supervises elections at all levels.
Ensures fairness, monitors political finance, and enforces model code of conduct.
3. Central Vigilance Commission (CVC)
Apex anti-corruption body for the central government.
Supervises vigilance administration, investigates corruption cases, and protects whistle-blowers.
4. Central Bureau of Investigation (CBI)
- Premier investigative agency handling corruption, economic crimes, and high-profile criminal cases.
5. Lokpal and Lokayuktas
Independent anti-corruption ombudsmen created under the Lokpal and Lokayuktas Act, 2013.
Investigate corruption complaints against public officials.
6. National Human Rights Commission (NHRC)
Investigates human rights violations by public authorities.
Recommends reforms, compensation, and safeguards.
7. Information Commissions (Central & State)
Created under the Right to Information Act, 2005.
Promote transparency by ensuring citizen access to government information.
8. Competition Commission of India (CCI)
Ensures fair competition and prevents abuse of market power.
Protects consumer interest and maintains economic governance.
9. Public Accounts Committee (PAC) & Estimates Committee
Parliamentary committees scrutinize public expenditure and administrative efficiency.
Strengthen accountability of the executive.
Malnutrition
Malnutrition refers to a condition in which a person’s intake or absorption of nutrients is inadequate, excessive, or imbalanced, affecting growth, health, and productivity.
It includes:
Undernutrition – stunting (low height), wasting (low weight for height), underweight, micronutrient deficiencies (iron, iodine, Vitamin A, zinc).
Overnutrition – overweight and obesity resulting from excess calorie intake.
Hidden hunger – deficiency of essential vitamins and minerals even when calorie intake is adequate.
Why treat malnutrition?
1. Long-term impact on human capital
Malnourished children suffer from poor cognitive development, low learning ability, and reduced future productivity.
2. High infant and child mortality
Undernutrition contributes to nearly 45% of under-five deaths, making it a major public health concern.
3. Inter-generational cycle of poverty
Malnourished mothers give birth to low-birth-weight babies, perpetuating poor health across generations.
4. Reduced economic growth
A less healthy workforce lowers productivity and increases health expenditure; malnutrition can reduce GDP by 2–3%.
5. Increased disease burden
Weak immunity leads to higher susceptibility to infections, increasing doctor visits and financial stress on families.
6. Social and gender inequality
Women and girl children are disproportionately affected due to unequal access to food and healthcare.
Measures to Address Malnutrition
1. Strengthening nutrition programmes
Expand and improve Integrated Child Development Services (ICDS), Anganwadi services.
Ensure effective implementation of Mid-Day Meal (MDM) and POSHAN Abhiyaan.
2. Maternal health and nutrition
Promote antenatal care, iron–folic acid supplementation, and counselling for pregnant and lactating mothers.
Encourage institutional deliveries and breastfeeding (early initiation + exclusive breastfeeding for 6 months).
3. Food security improvements
Strengthen Public Distribution System (PDS) with fortified staples (iron, folic acid, Vitamin A).
Provide diversified food baskets including pulses, millets, vegetables, and eggs.
4. Micronutrient supplementation and food fortification
- Salt iodisation, fortified rice/wheat, Vitamin A and iron supplements for children and women.
5. Water, sanitation, and hygiene (WASH)
- Reduce infections through safe drinking water, toilets, and hygiene awareness.
6. Behavioural change and awareness
- Educate families on balanced diets, child feeding practices, spacing of births, and hygiene.
7. Targeted interventions for vulnerable groups
- Tribal populations, migrant workers, urban poor, and disaster-affected communities need special support.
External Debt
External debt refers to the total outstanding borrowings of a country that need to be repaid in foreign currency.
It includes loans taken by the Government, private sector, public enterprises, commercial banks, and monetary authority from international agencies, foreign governments, and global financial markets.
These debts must be repaid through future foreign exchange earnings, making external debt an important indicator of a country’s external sector stability.
Magnitude of India’s External Debt (Brief Overview)
India’s external debt has grown steadily over the decades but remains manageable relative to GDP.
Total external debt is around 20% of GDP, which is considered moderate by international standards.
India’s foreign exchange reserves are large enough to cover most of the short-term external liabilities, indicating a low external vulnerability.
The composition has shifted over time toward long-term and less risky debt, reducing rollover risk.
Public sector debt remains significant, but private sector borrowings (ECBs, NRI deposits) have grown.
Overall, India is regarded as a country with a sustainable external debt position.
Characteristics of India’s External Debt
1. Dominance of Long-Term Debt
Over 80% of India’s external debt is long-term.
Short-term debt (which poses repayment risk) is relatively low.
2. Government vs. Private Sector Share
Government (sovereign) debt is substantial but declining as a share.
Private sector—especially corporates—borrows through External Commercial Borrowings (ECBs) and NRI deposits.
3. Concessional Nature of Multilateral Debt
- A portion of external debt comes from the World Bank, ADB, and bilateral lenders at low interest rates, which reduces the burden.
4. Low Debt-Service Ratio
- India’s Debt Service Ratio (DSR)—the proportion of export earnings used for debt repayment—remains low, showing healthy capacity to pay.
5. Currency Composition
External debt is mainly denominated in US dollars, followed by SDRs, yen, and euro.
This exposes India to exchange-rate risk, especially when the rupee depreciates.
6. Comfortable Foreign Exchange Reserves
- India’s forex reserves cover most short-term debt, giving high external stability.
7. Increasing Share of Non-Government Debt
- Corporates, banks, and NRI deposits now make up a large portion of total debt, reducing direct fiscal burden on government.
Indian Manufacturing Suffers from Weak Competitiveness
Indian manufacturing has consistently struggled to compete globally due to a mix of structural, infrastructural, and policy-related weaknesses. Major reasons include:
1. High Cost of Doing Business
Expensive logistics, slow transportation, port congestion.
High cost of electricity, land, and compliance.
Complex labour laws increase administrative burden.
2. Infrastructure Bottlenecks
Inadequate power supply, poor industrial corridors, and weak last-mile connectivity.
Delays in transport increase inventory and production costs.
3. Low Technology Adoption
Many firms use outdated technology, leading to low productivity.
Limited R&D investment (less than 1% of GDP).
Slow diffusion of automation, robotics, and digital manufacturing.
4. Small Firm Size and Fragmentation
A majority of firms are micro or small; they lack economies of scale.
Difficulty in accessing credit and skilled labour.
5. Skill Shortages
- Mismatch between training and industry needs.
- Low productivity due to lack of technical and vocational skills.
6. Rigid Labour Market and Regulatory Complexity
Multiplicity of labour laws, high compliance burden.
Smaller firms stay informal to avoid regulatory costs.
7. Low Export Orientation
Indian manufacturers are less integrated into global value chains.
High tariffs on inputs reduce export competitiveness.
8. Limited Innovation Ecosystem
Weak industry–academia linkages.
Low patenting and limited venture capital for manufacturing innovation.
Policy Measures to Improve Competitiveness
1. Improve Infrastructure and Logistics
Expand industrial corridors (DMIC, CBIC), SEZs, and plug-and-play industrial parks.
Strengthen multimodal logistics, reduce port and freight charges.
2. Promote Technology Upgrading
Provide incentives for automation, digitalisation, and Industry 4.0 technologies.
Increase public–private R&D spending and support innovation clusters.
3. Labour Law Reforms
Simplify and unify labour codes to reduce compliance cost.
Encourage formalisation and flexibility in hiring.
4. Access to Affordable Finance
Expand credit guarantee schemes and low-interest loans for MSMEs.
Promote development finance institutions for long-term industrial credit.
5. Skill Development
Strengthen Skill India, ITIs, apprenticeships, and industry-linked training.
Promote sector-specific skill councils.
6. Strengthen Global Value Chain Integration
Reduce tariffs on intermediate goods.
Promote export-oriented manufacturing through FTAs and logistics reforms.
7. Support MSMEs to Scale Up
Encourage cluster development, common facility centres, and technological hubs.
Provide digital platforms for marketing and supply chain integration.
8. Implement Industrial Policies Effectively
Continue Make in India, PLI schemes for electronics, pharma, textiles, semiconductors, automobiles.
Stabilise policy environment to attract FDI and long-term investments.
Agricultural Marketing
1. Regulated Market Committees (APMC Acts)
States established regulated markets (mandis) to eliminate middlemen and ensure transparent auctioning.
Aim: Standardised weighing, fair trader practices, and reduced exploitation.
2. Establishment of the Food Corporation of India (FCI), 1965
Ensures procurement of food grains at Minimum Support Price (MSP).
Provides assured market to farmers and stabilises prices.
3. Minimum Support Price (MSP) System
Introduced in 1966–67 to guarantee remunerative prices.
Protects farmers from market fluctuations and distress sales.
4. Cooperative Marketing Societies
Formation of NCDC, NAFED, and State cooperatives to strengthen farmer bargaining power.
Helps in procurement, storage, and distribution.
5. Warehousing and Storage Reforms
Establishment of Central Warehousing Corporation (CWC) and State Warehousing Corporations.
Scientific storage reduces post-harvest losses.
6. Grading and Standardization
Introduction of AGMARK for quality certification of agricultural commodities.
Helps farmers obtain better prices in domestic and export markets.
7. Contract Farming Policies
Legal frameworks developed in several states to link farmers with agro-industries.
Provides assured markets, modern inputs, and technology.
8. National Agricultural Market (e-NAM), 2016
A pan-India electronic trading platform integrating APMC mandis.
Promotes transparent price discovery, reduces role of intermediaries, and enhances farmer reach.
9. Development of Rural Infrastructure
Projects like PMGSY (rural roads), RKVY, and RIDF improve connectivity and reduce transportation costs.
Cold chains, refrigerated vans, and pack houses support perishable commodities.
10. Marketing of Horticultural and Perishable Products
Setting up of NHB (National Horticulture Board) and cold storage facilities.
Establishment of modern terminal markets.
11. Strengthening Market Information Systems
- AGMARKNET and other digital platforms provide real-time price information to farmers.
12. Farmer Producer Organizations (FPOs)
Encouraged since 2011; offer collective marketing, input purchase, and processing.
Improves scale economies and bargaining power.
13. Amendments in APMC Acts
States encouraged to allow private markets, direct marketing, and contract farming.
Promotes competition and wider choice for farmers.
Farming System → doubling farmers’ income
Yes, I agree. The farming system is central to doubling farmers’ income because it determines how efficiently land, labour, water, and capital resources are used. Improving the farming system leads to higher productivity, lower costs, diversified output, and reduced risk — all of which directly contribute to higher farm income.
1. Enhancing Productivity
Modern farming systems include improved seeds, better irrigation, soil health management, and mechanization.
Higher yields increase the value of output per hectare, raising farm income.
2. Crop Diversification
Moving from traditional cereals to high-value crops such as fruits, vegetables, pulses, oilseeds, spices, and floriculture boosts returns.
Diversification also reduces price and climate risks.
3. Integrated Farming Systems (IFS)
Combining crops with dairy, poultry, fisheries, beekeeping, and agro-forestry increases total farm output.
IFS ensures year-round income instead of seasonal earnings.
4. Adoption of Technology
Precision farming, drip irrigation, ICT tools, and scientific practices reduce input costs and improve efficiency.
Technology widens access to markets and weather information, improving decision-making.
5. Improved Post-Harvest Management
Value addition, grading, processing, and storage prevent post-harvest losses.
Better supply chains guarantee farmers a higher share of the final price.
6. Market Reforms
Access to e-NAM, FPOs, contract farming, and direct marketing increases price realization.
Stronger market linkages help farmers shift from production-based approach to income-based approach.
Thus, transformation in the farming system is a critical driver for doubling farmers' income.
Role of Non-Farm Income in Doubling Farmers’ Income
Non-farm income — income from activities outside crop farming, such as livestock, rural industries, services, manufacturing, and wage labour — plays an increasingly important role in rural livelihoods.
1. Reduces Dependence on Agriculture Alone
Agriculture is seasonal and often vulnerable to weather, pests, and price fluctuations.
Non-farm income provides regular and stable earnings, lowering risk.
2. Livestock as a Major Contributor
Dairy, poultry, goat-rearing, and fisheries provide continuous cash flow.
In many states, livestock contributes 30–40% of farmers’ income.
Growth in animal husbandry is faster than crop agriculture.
3. Rural Non-Farm Enterprises (RNFE)
Activities like food processing, tailoring, carpentry, transport services, construction work, and handicrafts supplement farming income.
These activities help families move from subsistence to surplus.
4. Employment During Lean Agricultural Seasons
Non-farm work fills the income gap during non-sowing or non-harvest months.
It prevents seasonal unemployment and stabilizes consumption.
5. MGNREGA and Other Wage Employment Programs
MGNREGA provides guaranteed wage employment and supports rural household income.
This reduces the need for distress migration.
6. Skill Development and Rural Industrialization
Government schemes promoting skills, MSMEs, food parks, and rural clusters create opportunities outside farming.
This diversifies income sources and improves resilience.
7. Connection to Doubling Farmers’ Income Goal
Studies show that doubling farm income cannot be achieved from agriculture alone.
A significant share must come from:
livestock,
agro-processing,
rural services,
micro-enterprises,
wage employment.
Non-farm income thus becomes a critical pillar of income growth
Structural Changes in the Indian Economy (Last 40 yrs)
Over the past forty years, the Indian economy has transformed from a controlled, inward-looking economy to a market-driven, globally integrated system. These changes span production, trade, finance, employment, and governance.
1. Shift from Agriculture to Services
In 1980s, agriculture accounted for over 35% of GDP; today it is below 15%.
Services—IT, telecom, finance, healthcare—now contribute over 55% of GDP.
Structural transformation has moved labour and resources toward higher-value sectors.
2. Rise of the Private Sector
Reduction of licensing, deregulation, and economic liberalisation since 1991.
Private sector expanded in manufacturing, banking, telecom, aviation, retail, and infrastructure.
Public sector dominance declined.
3. Trade Liberalisation and Global Integration
Removal of import licensing, reduction of tariffs, and promotion of exports.
India became part of global value chains in IT, pharmaceuticals, auto components, textiles.
Foreign trade as a share of GDP rose significantly.
4. Growth of Foreign Investment
FDI permitted across multiple sectors after 1991 reforms.
Portfolio investments deepened India’s capital markets.
External sector became more resilient with higher forex reserves.
5. Financial Sector Reforms
Deregulation of interest rates, entry of private banks, strengthening of capital markets (SEBI).
Development of insurance, mutual funds, and corporate bond markets.
Introduction of IBC (2016) improved credit discipline.
6. Fiscal and Tax Reforms
Shift toward fiscal responsibility through FRBM Act (2003).
Introduction of GST (2017) unified the indirect tax system.
Reduction in corporate tax rates and rationalisation of subsidies.
7. Technological and Digital Transformation
Expansion of telecom and internet; emergence of digital economy.
Aadhaar, UPI, Jan Dhan, and DBT revolutionised financial inclusion and governance.
Start-up ecosystem and innovation accelerated.
8. Structural Changes in Manufacturing
Growth in automobiles, electronics, pharmaceuticals, engineering goods.
Yet manufacturing as a share of GDP remains around 15–17%, reflecting slow transformation.
Policies such as Make in India and PLI schemes aim to boost competitiveness.
9. Agricultural Transformation (Partial)
Declining share in GDP but rising productivity in some states.
Shift toward horticulture, dairy, poultry, fisheries.
Expansion of MSP, irrigation, micro-irrigation, and e-NAM.
10. Demographic and Labour Market Changes
Large youth population entering labour force.
Shift toward informal and services-based employment.
Growth of urbanisation and migration from rural to urban jobs.
11. Greater Focus on Social Sector Development
Expansion of education, health, nutrition, rural development schemes.
MNREGA improved rural employment security.
Growth of welfare programmes using digital delivery.
SHORT NOTES
(a) Fiscal Deficit
Fiscal deficit is the excess of the government’s total expenditure over its total revenue (excluding borrowings) in a given financial year.
It indicates how much the government needs to borrow to meet its expenditure.
Formula:
Fiscal Deficit = Total Expenditure – (Revenue Receipts + Non-Debt Capital Receipts)
A high fiscal deficit implies higher government borrowing, possible future inflation, and increased interest burden. A moderate deficit is often used to stimulate growth during recessions.
(b) Minimum Support Price (MSP)
MSP is the minimum guaranteed price announced by the Government of India for certain agricultural crops before the sowing season.
It ensures farmers a floor price so they are protected from sharp price falls in the market.
Key features:
Recommended by the CACP (Commission for Agricultural Costs and Prices).
Implemented mainly through public procurement agencies like FCI.
Encourages production of staples (wheat, rice) and ensures food security.
(c) Poverty Line
The poverty line is a threshold level of income or consumption needed to meet basic minimum needs such as food, clothing, shelter, education, and health.
Key points:
In India, poverty lines were earlier based on calorie intake; now they use Tendulkar Committee (2009) and Rangarajan Committee (2014) methodologies.
People below the poverty line (BPL) lack sufficient resources to meet essential needs.
Used for policy targeting and welfare programmes.)
(d) Externalities
Externalities are costs or benefits of an economic activity that affect third parties who are not directly involved in the transaction.
Types:
Negative externalities: pollution, congestion, overuse of resources.
Positive externalities: vaccination, education, research.
Externalities cause market failure because the private cost/benefit differs from the social cost/benefit, requiring government intervention (taxes, subsidies, regulation).
(e) Human Development Index (HDI)
HDI is a composite index developed by the UNDP to measure a country’s overall human development.
It includes three dimensions:
Health: Life expectancy at birth
Education: Mean years of schooling + expected years of schooling
Standard of living: Gross National Income (GNI) per capita (PPP)
HDI ranges from 0 to 1, with higher values indicating better human development.
It is used to compare countries’ social progress beyond just GDP.
(f) Drain of Wealth During the British Period
The drain of wealth refers to the systematic transfer of resources, income, and wealth from India to Britain during colonial rule without adequate economic return. This occurred through:
Excessive land revenue and taxation
Profits of British trading companies
Home charges (payments for salaries, pensions, and administrative costs of British officials)
Remittance of savings by British officers
Unequal trade policies where India exported raw materials cheaply and imported expensive British goods
The drain resulted in capital scarcity, deindustrialisation, poverty, and slow economic growth in pre-independence India.
(g) Foreign Exchange Reserves
Foreign exchange reserves are the external assets held by the Reserve Bank of India (RBI) in the form of:
Foreign currencies (mainly US dollars)
Gold reserves
SDRs (Special Drawing Rights)
Reserve position in the IMF
Reserves help maintain exchange-rate stability, support international payments, build investor confidence, and act as a buffer against external shocks. India’s high reserves strengthen its external sector and reduce vulnerability to global crises.
(h) Repo Rate
The repo rate is the rate at which the RBI lends short-term funds to commercial banks by purchasing government securities with an agreement to sell them back later.
It is a key monetary policy tool used to control:
Inflation (higher repo → costlier loans → reduced demand)
Money supply
Borrowing costs in the economy
A decrease in repo rate makes loans cheaper, boosting investment and consumption. It directly influences EMIs, bank lending rates, and overall liquidity.
(i) Buffer Stocks
Buffer stocks refer to food grains (mainly wheat and rice) procured and stored by government agencies like FCI.
Purpose:
Ensure food security
Stabilise prices by releasing grain during shortages
Supply PDS and welfare schemes
Provide emergency relief during droughts or disasters
Buffer stocking helps protect consumers from inflation and farmers from distress sales, though excessive stocks create storage and fiscal burdens.
(j) Good Governance
Good governance refers to an administrative system characterized by accountability, transparency, rule of law, efficiency, responsiveness, participation, and equity.
It ensures corruption-free processes, effective service delivery, and citizen-centric administration.
Institutions like CAG, Election Commission, Judiciary, Lokpal, RTI Act, and digital reforms (Aadhaar, DBT, e-governance) strengthen good governance in India.
(k) Insolvency and Bankruptcy Code (IBC)
The Insolvency and Bankruptcy Code, 2016 is a comprehensive law to resolve insolvency of companies, individuals, and partnerships in a time-bound manner.
It introduced a 180–270 day resolution process, created the Insolvency and Bankruptcy Board of India (IBBI), and established Insolvency Professionals and NCLT as adjudicating authority.
IBC improved credit discipline, reduced non-performing assets, and enhanced the ease of doing business by enabling faster resolution or liquidation of distressed firms.
(l) Sub-National Borrowing
Sub-national borrowing refers to loans raised by state governments and local bodies to finance development projects.
It is done mainly through State Development Loans (SDLs), loans from financial institutions, and central assistance.
While it helps states invest in infrastructure and social schemes, excessive borrowing raises concerns about fiscal discipline, requiring monitoring under FRBM rules and the recommendations of the Finance Commission.
(m) Industrial Sickness
Industrial sickness refers to a situation where a manufacturing or industrial unit becomes financially unviable, showing prolonged losses, negative net worth, and inability to meet obligations.
Causes include poor management, outdated technology, inadequate working capital, power shortages, and market decline.
Institutions like BIFR (now dissolved), revival packages, and IBC aim to detect sickness early and support restructuring or closure.
(n) PPP (Public–Private Partnership)
A PPP is a collaboration between the government and private sector for developing infrastructure or delivering public services.
The private partner invests capital and brings technology/efficiency, while the government provides support like land, viability gap funding, or revenue guarantees.
PPPs are widely used in roads, airports, metro rail, power, healthcare, and urban services.
They help reduce fiscal burden, improve service quality, and accelerate infrastructure development.
(o) Merit Goods
Merit goods are goods and services that the government believes are socially desirable and should be consumed more than what the market would provide.
Examples: education, healthcare, vaccination, sanitation, nutrition programs.
Because people may underestimate their benefits, the government promotes them through subsidies, public provision, or regulation to ensure equitable access.
(p) Equity Derivatives
Equity derivatives are financial instruments whose value is derived from underlying stocks or equity indices.
Common forms include futures, options, swaps, and index derivatives.
They are used for hedging risk, speculation, and arbitrage, allowing investors to manage stock market volatility.
SEBI regulates the equity derivatives market in India.
(q) UNDP (United Nations Development Programme)
UNDP is a global development agency of the United Nations that works in more than 170 countries to reduce poverty, strengthen governance, promote human development, and support climate resilience.
It publishes the Human Development Report, which includes key indicators like HDI, inequality-adjusted HDI, and gender indices. UNDP assists countries like India in policy reform, capacity building, and sustainable development programmes.
(r) Poverty Gap Index
The Poverty Gap Index measures the depth of poverty by showing how far, on average, the poor are below the poverty line.
It is calculated as the average shortfall from the poverty line as a proportion of the poverty line, considering only those who are poor.
It helps identify the intensity of poverty and guides governments in designing targeted anti-poverty policies.
(s) Own-Account Worker
An own-account worker is a self-employed person who operates their own enterprise without hiring any paid employees.
Examples include street vendors, small shopkeepers, artisans, farmers, and independent service providers.
They dominate India’s informal sector and often face challenges like low income, lack of social security, and limited access to credit or markets.
(t) Underemployment
Underemployment refers to a situation where a person is employed but not fully utilised according to their skills, time, or capacity.
Examples include:
Working fewer hours than desired
Doing jobs requiring less skill than one possesses
Earning below potential
Underemployment is widespread in developing countries like India due to disguised unemployment in agriculture and lack of quality jobs.
(u) Inclusive Growth
Inclusive growth refers to economic growth that is broad-based, equitable, and benefits all sections of society, especially the poor and marginalised.
It focuses on equal access to opportunities such as education, health, credit, infrastructure, and employment.
Policies promoting inclusive growth include MGNREGA, financial inclusion (Jan Dhan–Aadhaar–UPI), social security schemes, and investments in rural development and human capital.
The goal is growth that reduces poverty and inequality while sustaining long-term development.
(v) Goods and Services Tax (GST)
GST, introduced in 2017, is a unified indirect tax system that replaced multiple central and state taxes like excise, VAT, and service tax.
It follows the principle of “One Nation, One Tax, One Market”, creating a common national market.
GST is levied on value addition at each stage and is administered through the GST Council.
Benefits include easier compliance, reduced cascading of taxes, improved logistics, and enhanced tax efficiency.